
Introducing Search & Navigation Dashboard for Resource Usage
We're excited to unveil the latest addition to the Search & Navigation suite: a dashboard designed to proactively monitor your resource usage. It's a powerful tool that offers immediate insights, helping you prevent potential issues before they impact your service.
Proactive Monitoring at Your Fingertips
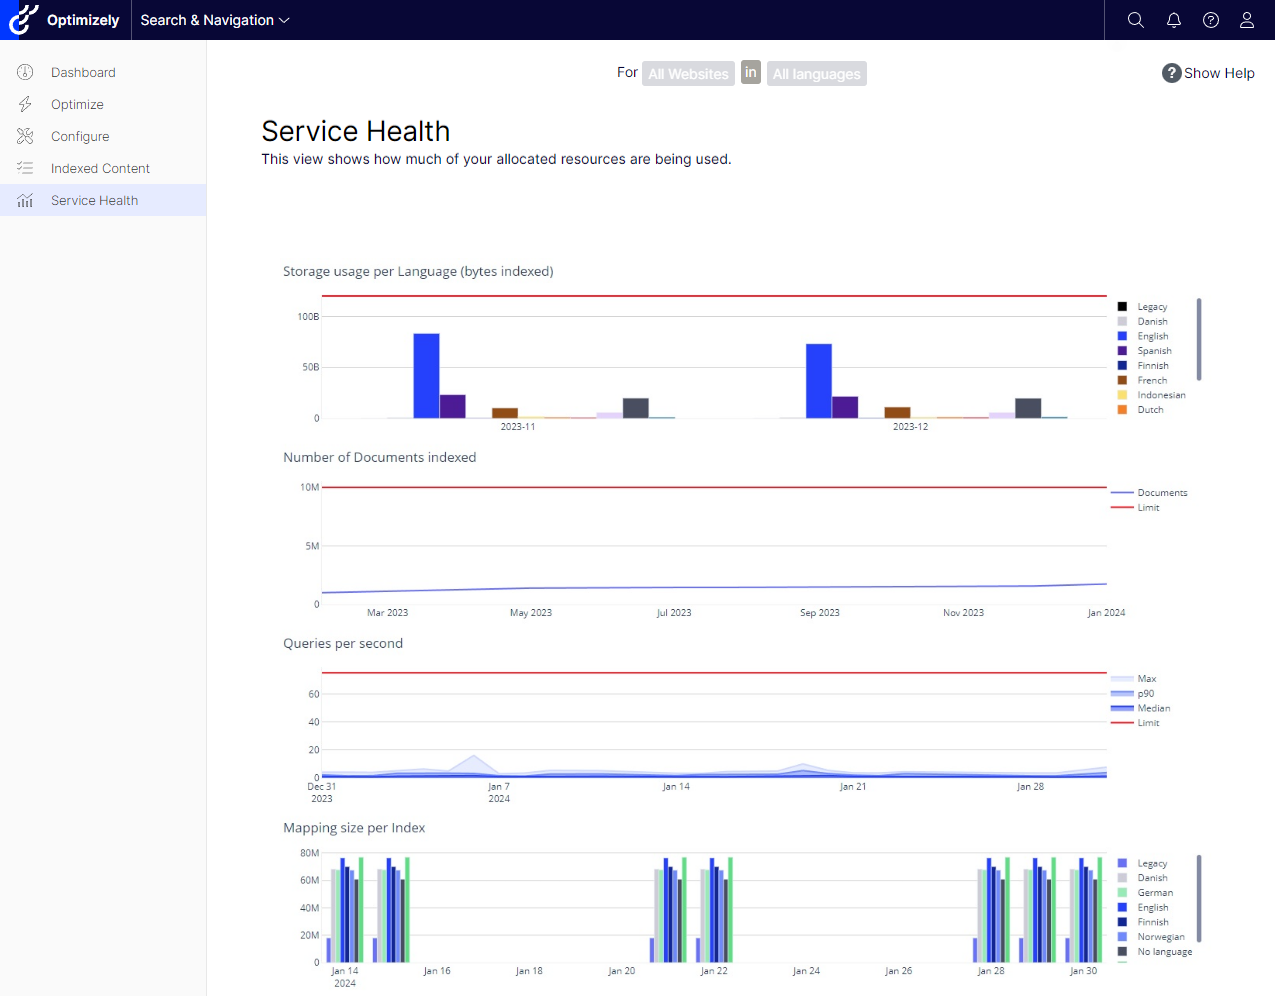
Effective resource management is key to maintaining a robust search and navigation system. Our new dashboard, developed with Dash Plotly and hosted on Azure, provides an integrated view of your usage patterns. It enables you to track document counts, storage, and query metrics, ensuring you never unknowingly exceed your limits.
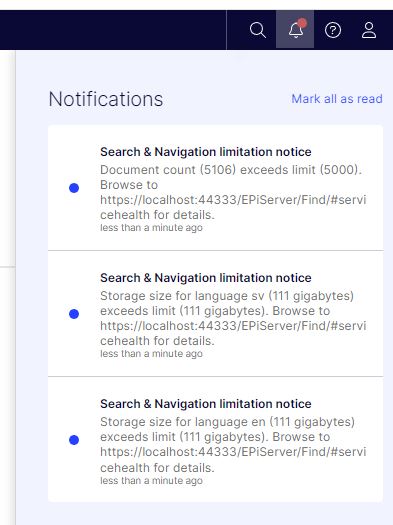
Stay Informed With Real-Time Notifications
Our goal is to make it as easy as possible for you to stay on top of your resource usage. With the new notification system, you'll receive real-time alerts when you're approaching a "health limit." Whether it's too many documents indexed, excessive data indexed for one language, or a mapping size that's become too large.
Accessing the Dashboard
Getting to the dashboard is straightforward:
- Via the admin view in the Optimizely .NET Core client, under Search & Navigation > Service Health
- Directly through the dashboard's URL, using your service URL and default index from the Web.config in your .NET Core Client
<configuration>
   <configSections>
      <section name="episerver.find" type="EPiServer.Find.Configuration, EPiServer.Find" requirePermission="false"/>
   </configSections>
   <episerver.find serviceUrl="https://your-host-cluster.find.episerver.net/your-secret-key" defaultIndex="your_default_index"/>
</configuration>
Looking Ahead
We're committed to continuously refining the tools you need to effectively oversee and enhance your search and navigation resources. Your feedback is invaluable in this ongoing process.
The new Search & Navigation Dashboard isn't just a technical tool — it's your business ally, ensuring efficiency and preempting problems. Try it out and share your experience; we're here to assist and evolve with you.
Let this dashboard be the compass that guides your search service to smooth sailing. We look forward to your insights and are here to support your journey towards operational excellence.
Comments